Hi Guest

MobileUser

1 HomePage 1 Jobs 1 WalkIn 1Articles  

Cat Exam

 :) Latest Topic
VB.NET
Perl
COBOL
Pascal
FORTRAN
BASIC
Ada
C++
Scala
ASP.NET
 C
 :) Hot Jobs
 
 :) Latest Articles


Create Bar Charts in R Language?
Question Posted on 02 Mar 2021

Home >> Programming Languages >> R Basic >> Create Bar Charts in R Language?


Create Bar Charts in R Language?
First we will discuss what is bar chart. A bar chart is created by rectangle bars to display data. we can display bar charts horizontal or vertical. Length and height of the bars are proportional to the values they represent. We use barplot() function to draw a vertical bar chart. Below is the example for bar charts values:-


#x-axis Values as given below
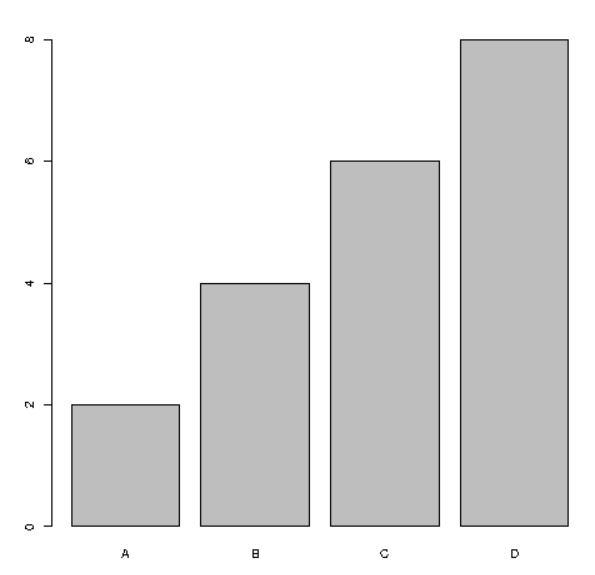
x<- c("A","B","C","D")

#y-axis Values as given below
y<- c(2,4,6,8)

barplot(y,companyname.arg=x)


Barchart R
In above example below are some points
(1)x variable represent values on x-axis(A,B,C,D)
(2)y variable represent values on y-axis(2,4,6,8)
(3)We use barplot() function to create bar chart of values
(4)companyname.arg defines name of each oberservation on x-axis
0
0


 Input Your Comments Or suggestions(If Any)
 Name
 Email(optional)
 Comments


Other Important Questions
Create Bar Charts in R Language?
What are the Missing and Impossible values in R language?
Which command allows you to get the median tree Height of the R sample dataset "trees"?
What command will you enter in the R console to get help on how to quit R?
In R, the subsequent data types are all atomic data types except _____________.


Top Searches:asp net questions vb net questions sql query uddl questions class javascript Questions sharepoint interview questions and concept silverlight questions and concept wcf questions beans general knowledge ajax questions
PHP | Biztalk | Testing | SAP | HR |